
Yodest builds embedded dashboards on top of the systems you already run - EHR, call center, workforce - so leaders stop pulling spreadsheets and start seeing where time, money, and patient access are leaking.
Most teams already collect the data. We turn it into something a supervisor can act on the moment a shift ends.
Live KPI tiles for volume, quality, RONA rate, and schedule adherence - with a leadership view and a personal self-view for every navigator.
See where the day actually goes - active work vs idle time, ramp-up and wind-down, hours lost to late starts - down to the individual and the date.
Track referral speed, backlog age, and same-day close rates in real time so bottlenecks surface before they reach a patient.
Deployed in Tableau or Power BI, fully branded, connected to your existing systems - owned and maintained by your team.
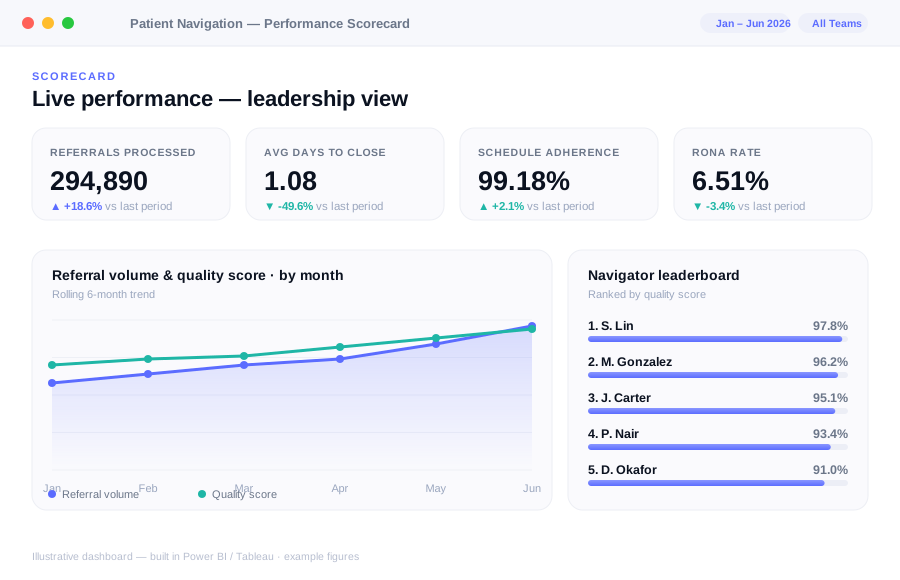
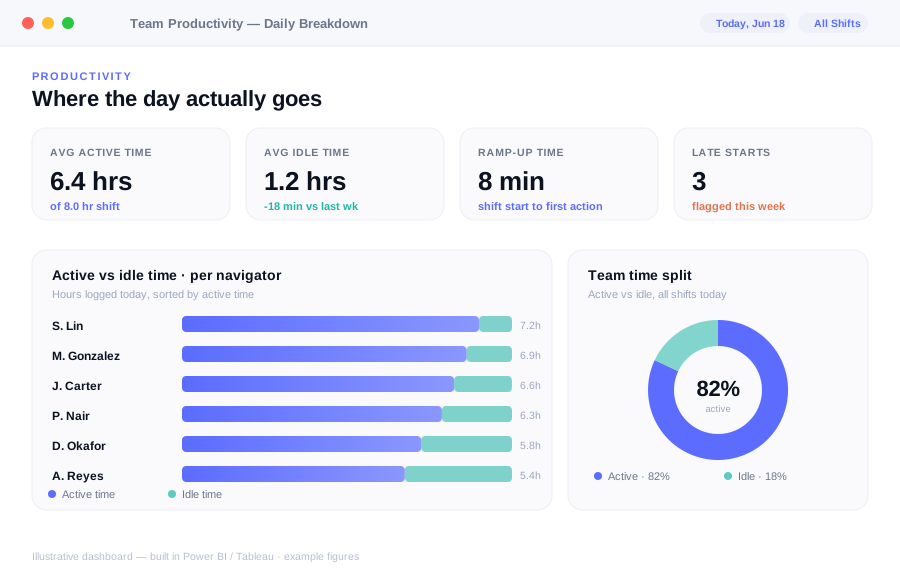
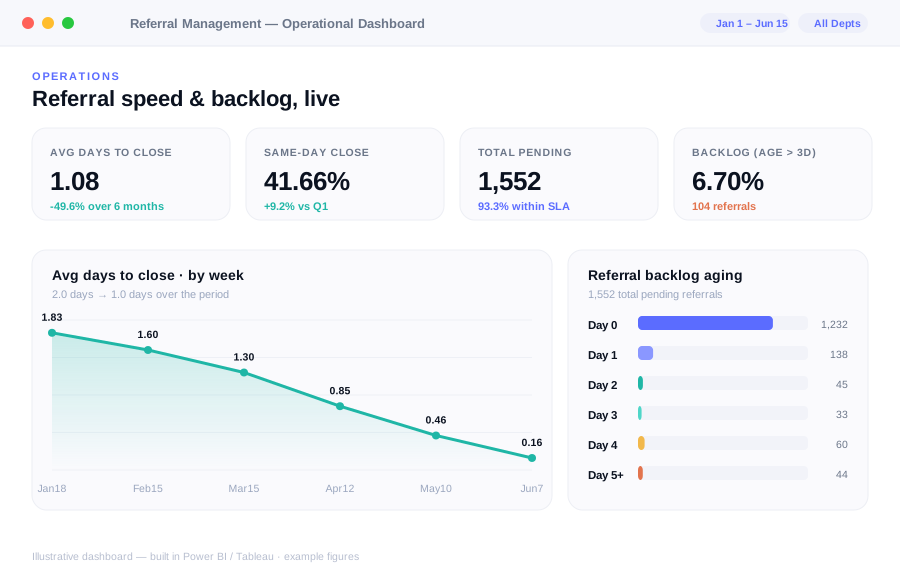
Every chart here draws itself from real metric shapes - the same animated, real-time feel your team gets inside the dashboards.
Drag the sliders to match your navigation team. Estimates use the throughput and turnaround gains seen across our deidentified client work.
Illustrative model. Actual results vary by team size, workflow, and implementation.
A structured three-step engagement. You end up owning the solution outright - not renting it.
Our team develops the complete dashboard suite from the ground up, handling data modeling, calculations, and design so your team doesn't have to.
We work alongside your people, walking through every component and calculation until they're fully confident running it themselves.
Once handed over, your team owns and operates it independently. We stay available for support whenever you need us.
A 30-minute call is enough to find the first bottleneck worth fixing.
Book a discovery call