What we build

A dashboard suite that runs
the whole navigation operation.

Three connected views - performance, productivity, and operations - built on your existing systems in Tableau or Power BI, fully branded, and handed over for your team to own.
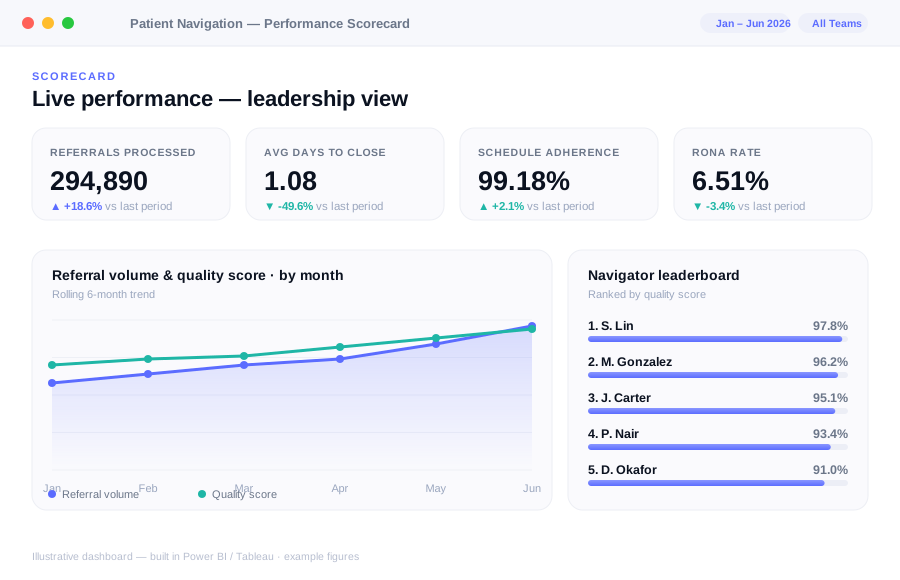
Patient Navigation Scorecard
Dashboard 01 · Scorecard

Performance Scorecard

Real-time performance visibility for leadership and every navigator, in one tool with two audiences.
  • Eight live KPI tiles: volume, quality, RONA rate, schedule adherence, digital engagement
  • Leadership view with team comparisons and a full navigator leaderboard
  • Agent self-view: each navigator sees their own trends, benchmarks, and coaching insights
  • Filter by any date range, supervisor, or individual in two clicks
Productivity Dashboard
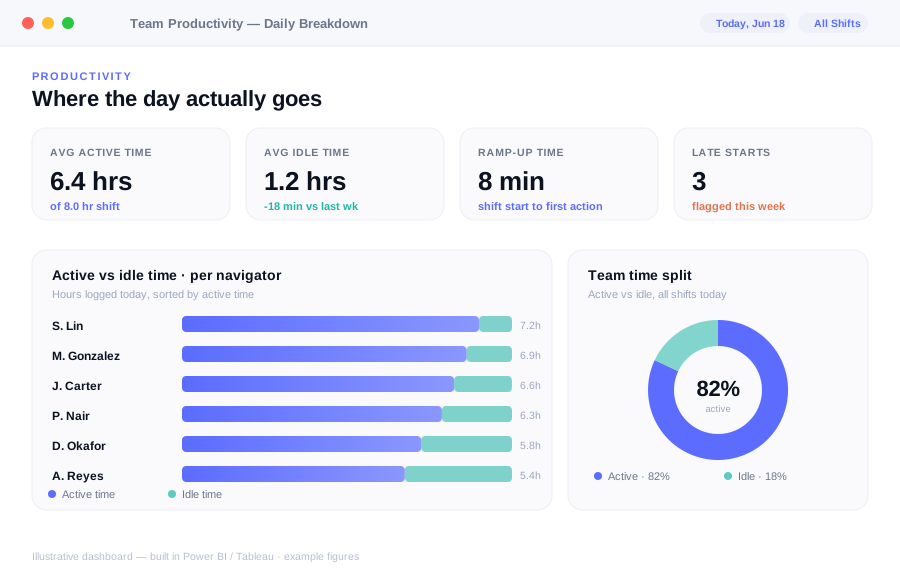
Dashboard 02 · Productivity

Productivity Dashboard

Stop guessing where the team's time goes. Measure the pace of work itself.
  • Active touch time vs idle/wait time, per navigator per day
  • Shift ramp-up and wind-down - two numbers most teams have never tracked
  • Hours lost to late starts and early stops, color-coded by severity
  • A complete, timestamped audit trail of every action, exportable to Excel
Operational Dashboard
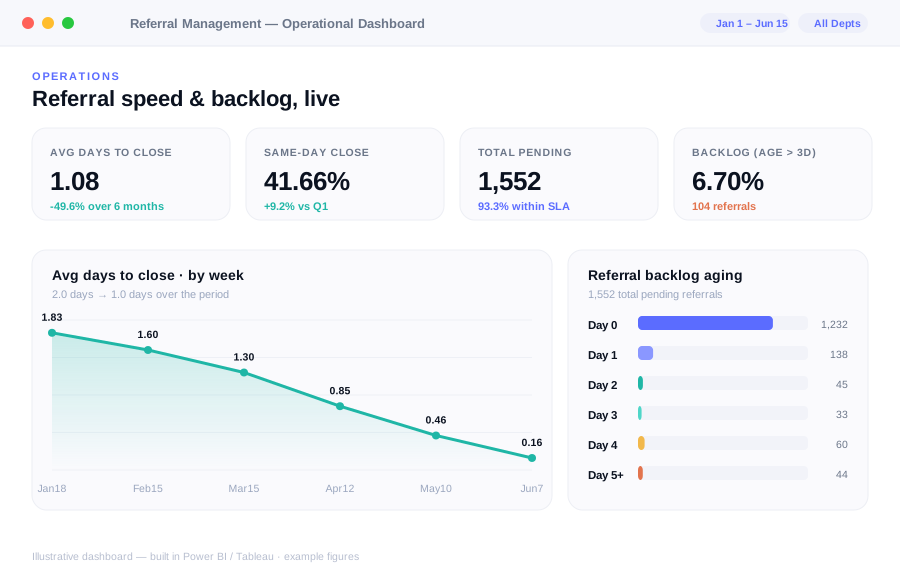
Dashboard 03 · Operations

Operational Dashboard

Control turnaround time and catch backlogs before they reach a patient.

  • Same-day, next-day, and three-day close rates, calculated automatically
  • Backlog age buckets and aging thresholds you define
  • A live detail table of every open referral - priority, department, supervisor, age
  • Weekday vs weekend volume tracked separately for smarter staffing
Under the hood

Every metric is defined, calculated, and sourced

We document each measure down to the formula and the source table, so your team knows exactly what every number means.

Scorecard

Units per day

Referrals + inbasket + DME orders combined into a single daily productivity index per coordinator.

Productivity

Active vs idle

Share of time inside short gaps between actions vs long idle gaps, against a threshold you set.

Operations

Days to process

Calendar days a referral sits in the queue from entry to close, bucketed Day 0 through Day 8+.

Examples shown are based on deidentified client deliverables and are illustrative.

Who it's for

The same approach scales up or down

Whether you run a department of eight or a navigation organization of eighty, the build adapts to your structure, shift hours, and targets.

Large teams

60–80+ staff

At scale, small inefficiencies compound fast. Surfacing idle time and turnaround drift across dozens of navigators is where the $1M+ annual savings come from.

Lean teams

5–20 staff

Smaller teams can't afford an analyst building spreadsheets all week. A self-running dashboard gives a single supervisor the same visibility a whole BI team would.

Ready to see it on your data?

We'll scope the first dashboard in a single call.

Book a discovery call